
Simvestrix Guide — tracking, analysis & a demo portfolio
A guide for beginners and advanced users
How to start using Simvestrix — without the noise
Track and analyze stocks with a demo portfolio, candlestick charts, and RSI/MACD/Bollinger. If you choose — you can also connect a supported third-party brokerage account (optional) to execute actions from within the platform.
Disclosure: The information is not investment advice. Trading connection is optional and happens with user authorization only.
In a few minutes you’ll learn how to: get a market snapshot, find a stock, open the chart, and add it to a demo portfolio and Watchlist. If you choose — you can also connect a supported third-party brokerage account (optional) to execute actions from within the platform.
- Sign in / sign up to save your portfolio, lists, and settings.
- Add your first stock via the Search page.
- On the chart, enable MA200 and RSI for a quick baseline.
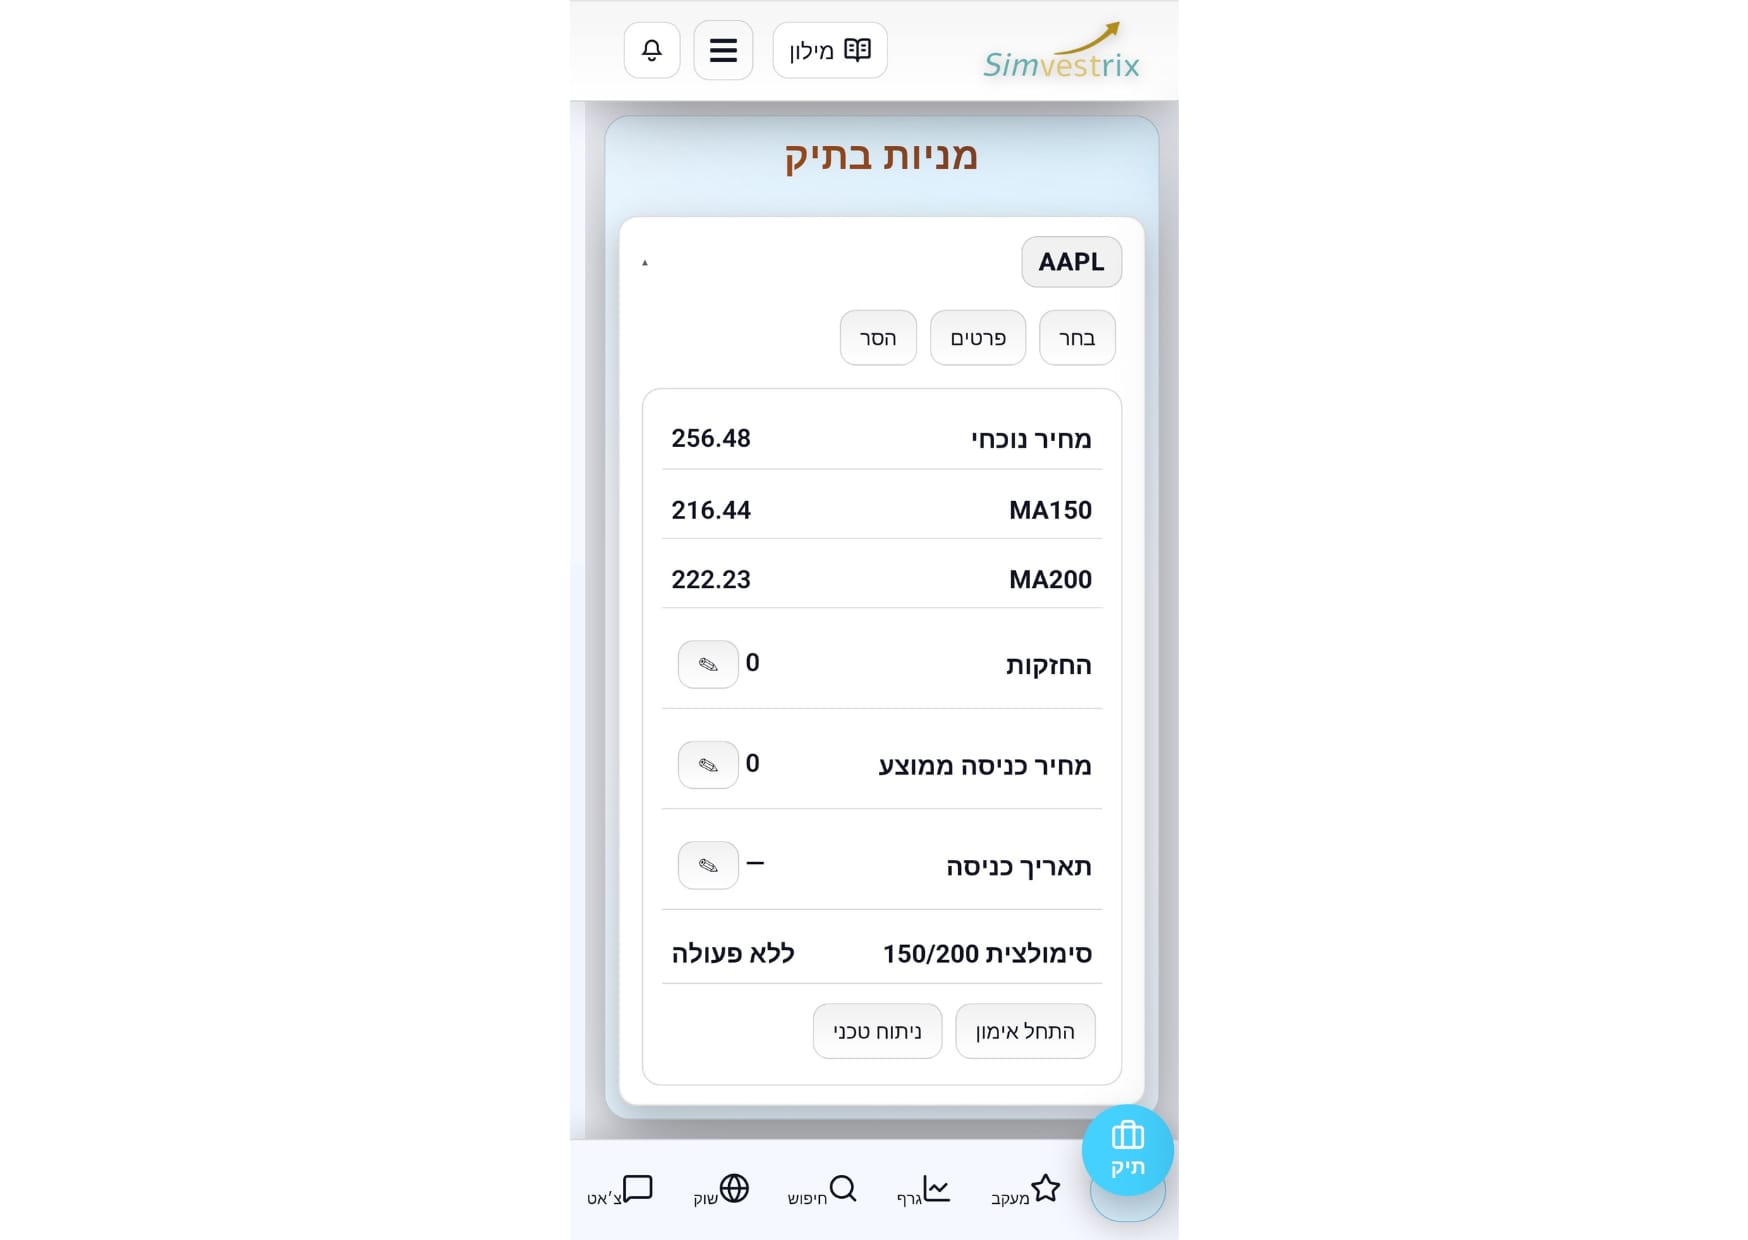
Step 1 — Demo portfolio (home page)
This is your demo portfolio: add stocks, set average price and shares, and track value and return. Practice only — no real money.
- Add stocks: type a symbol (AAPL/NVDA/…) or pick from suggestions.
- Update position: avg price + shares → portfolio value & return.
- Quick actions: open chart, details/delete/alerts.
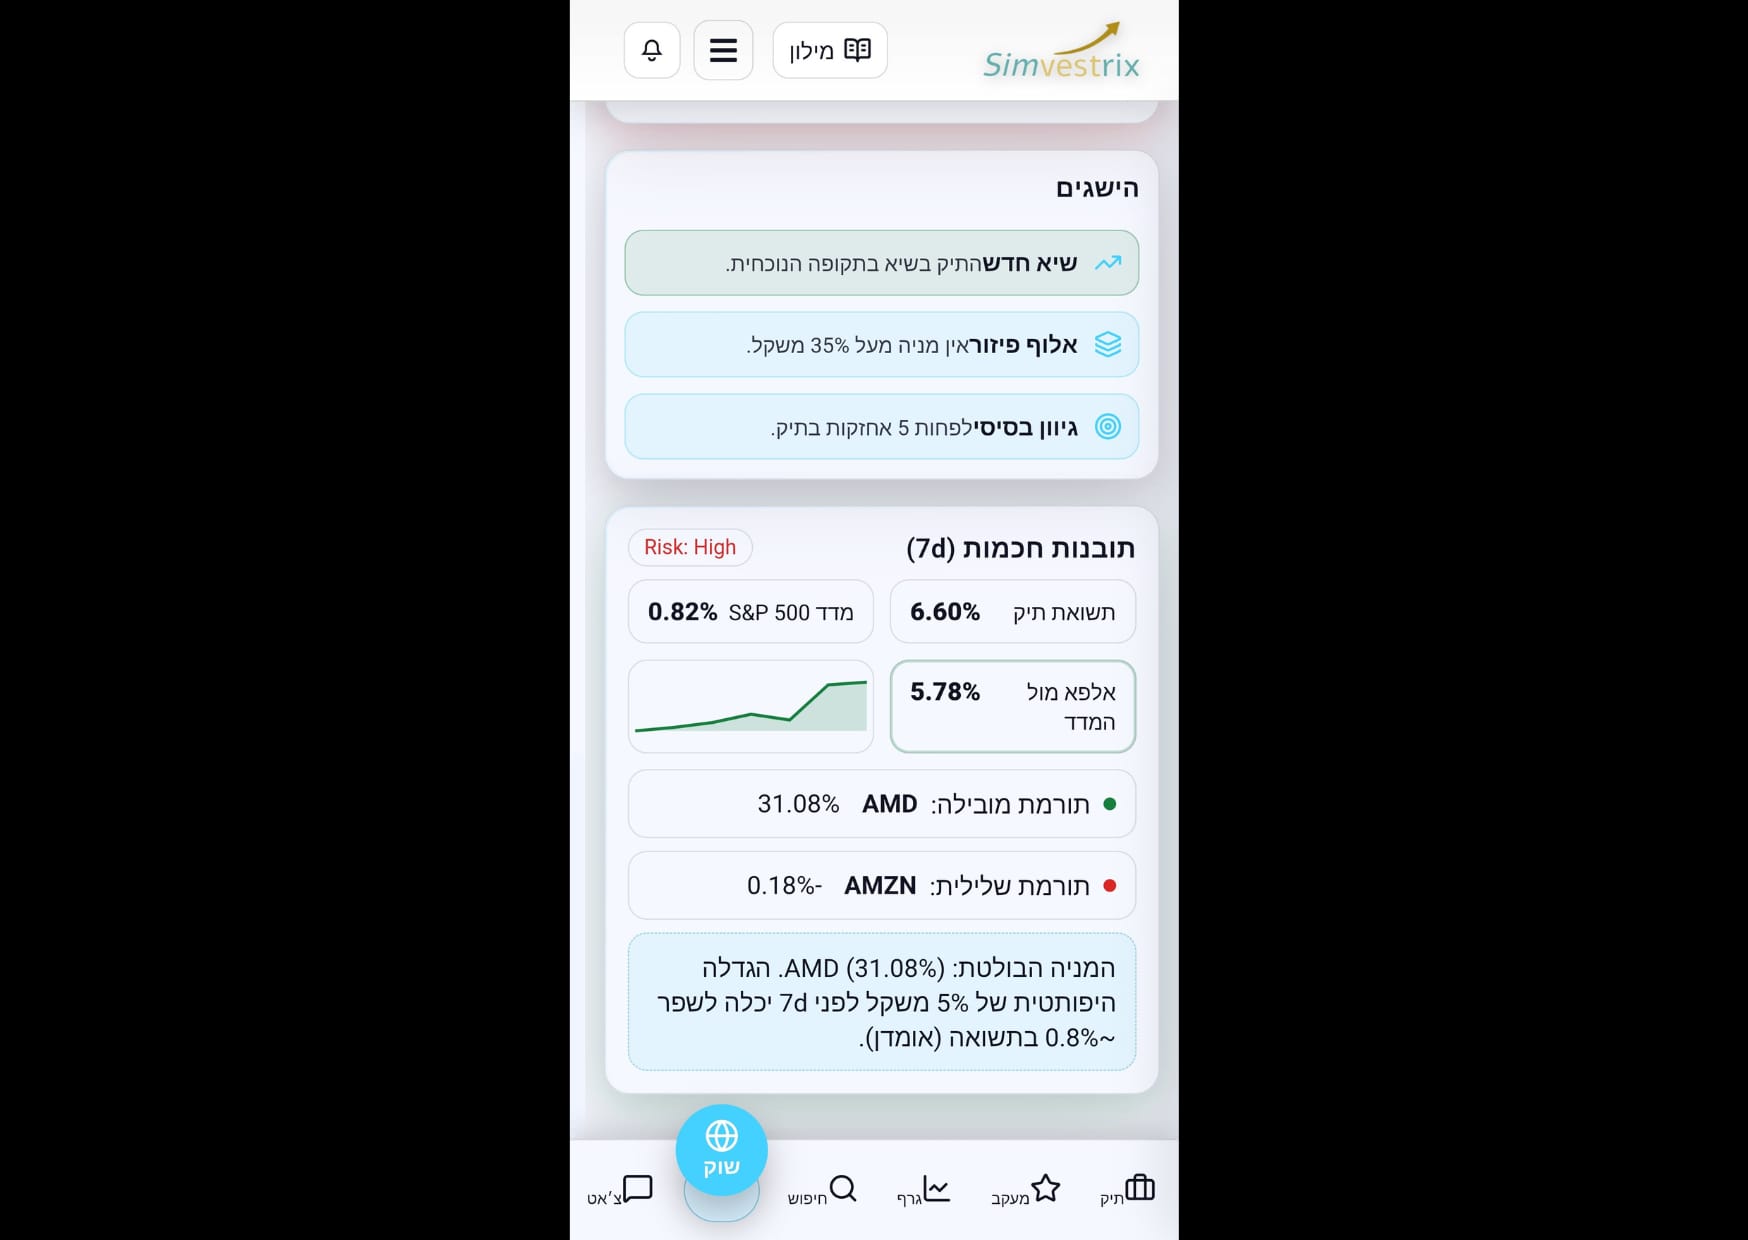
Step 2 — Market page (overview)
A quick snapshot: indexes, comparisons, and short insights that focus what to check now.
- Index cards: daily change and a mini chart.
- Performance comparisons: see what leads the market.
- Jump to Search/Chart when something stands out.
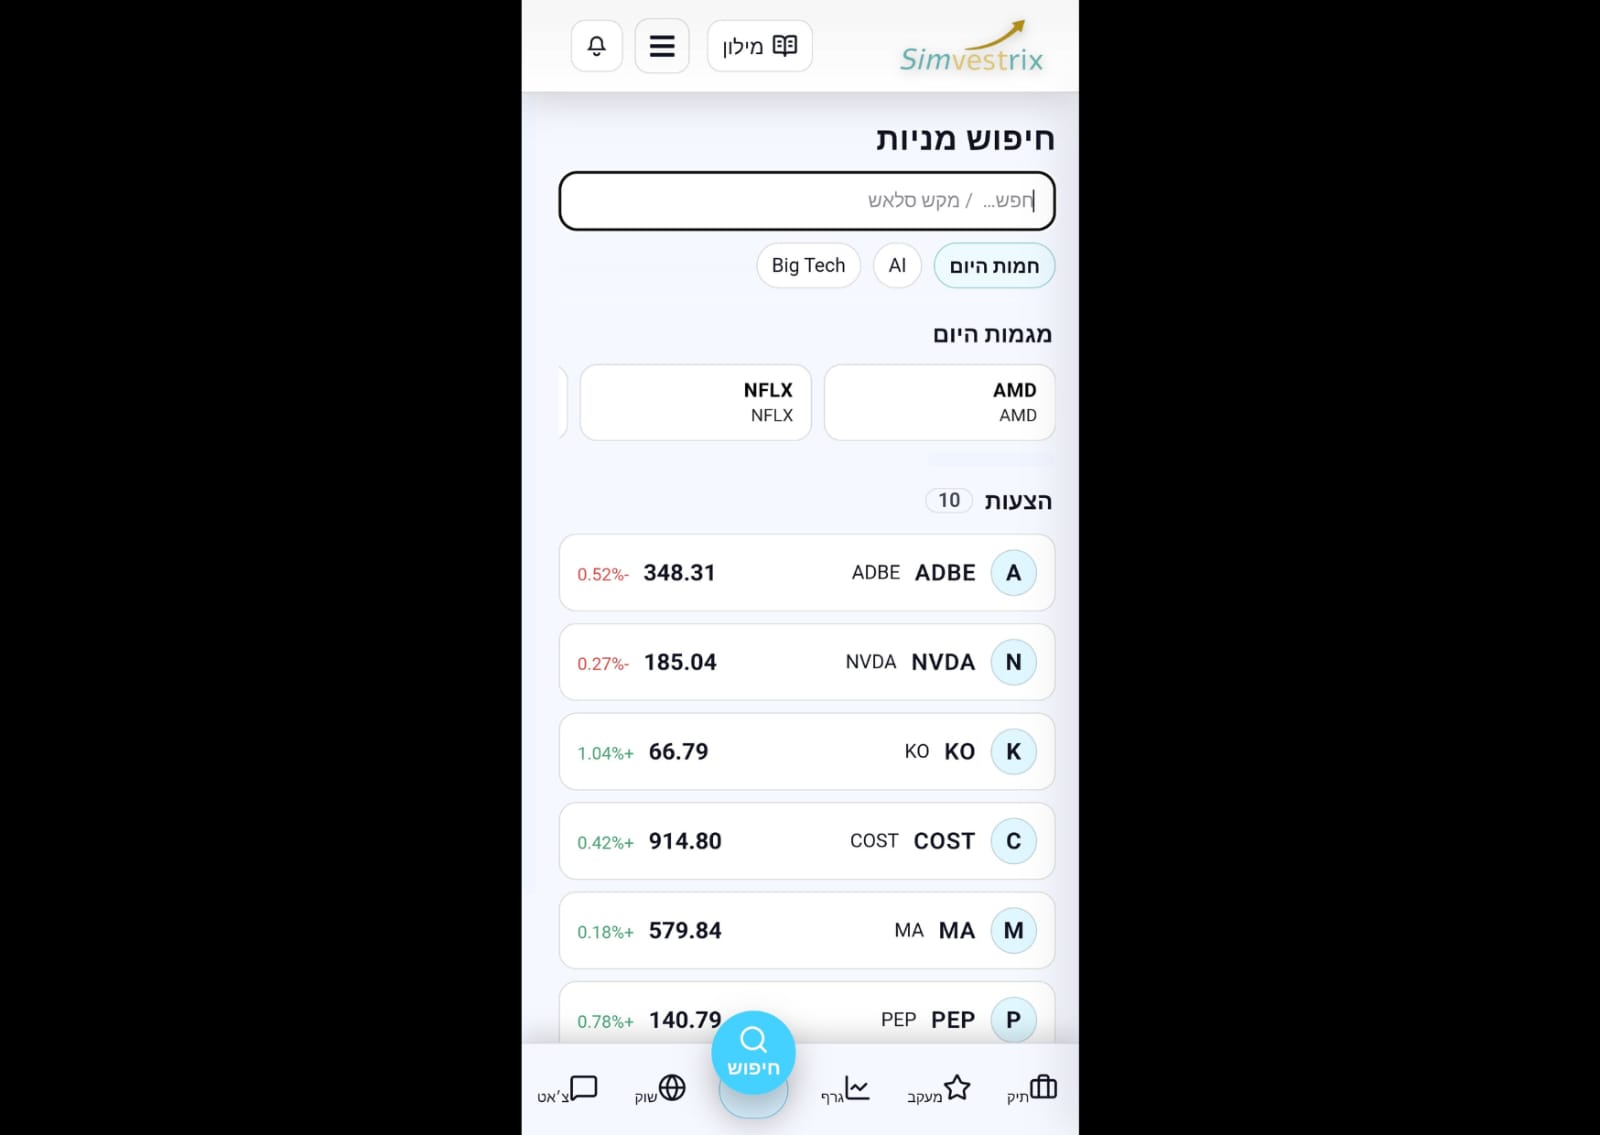
Step 3 — Stock search
Find stocks fast: search by symbol/name, chips (Big Tech/AI), and “today’s trends”. From each card: ➕ to portfolio or ⭐ to Watchlist. On narrow/mobile screens, swipe the card left to reveal ➕/⭐ actions.
- Type a symbol (AAPL) or company name (Apple) and press Enter.
- On a card: ⭐ Watchlist • ➕ Portfolio • click opens the chart.
- If you don’t see actions: swipe the card left (mobile/narrow screens).
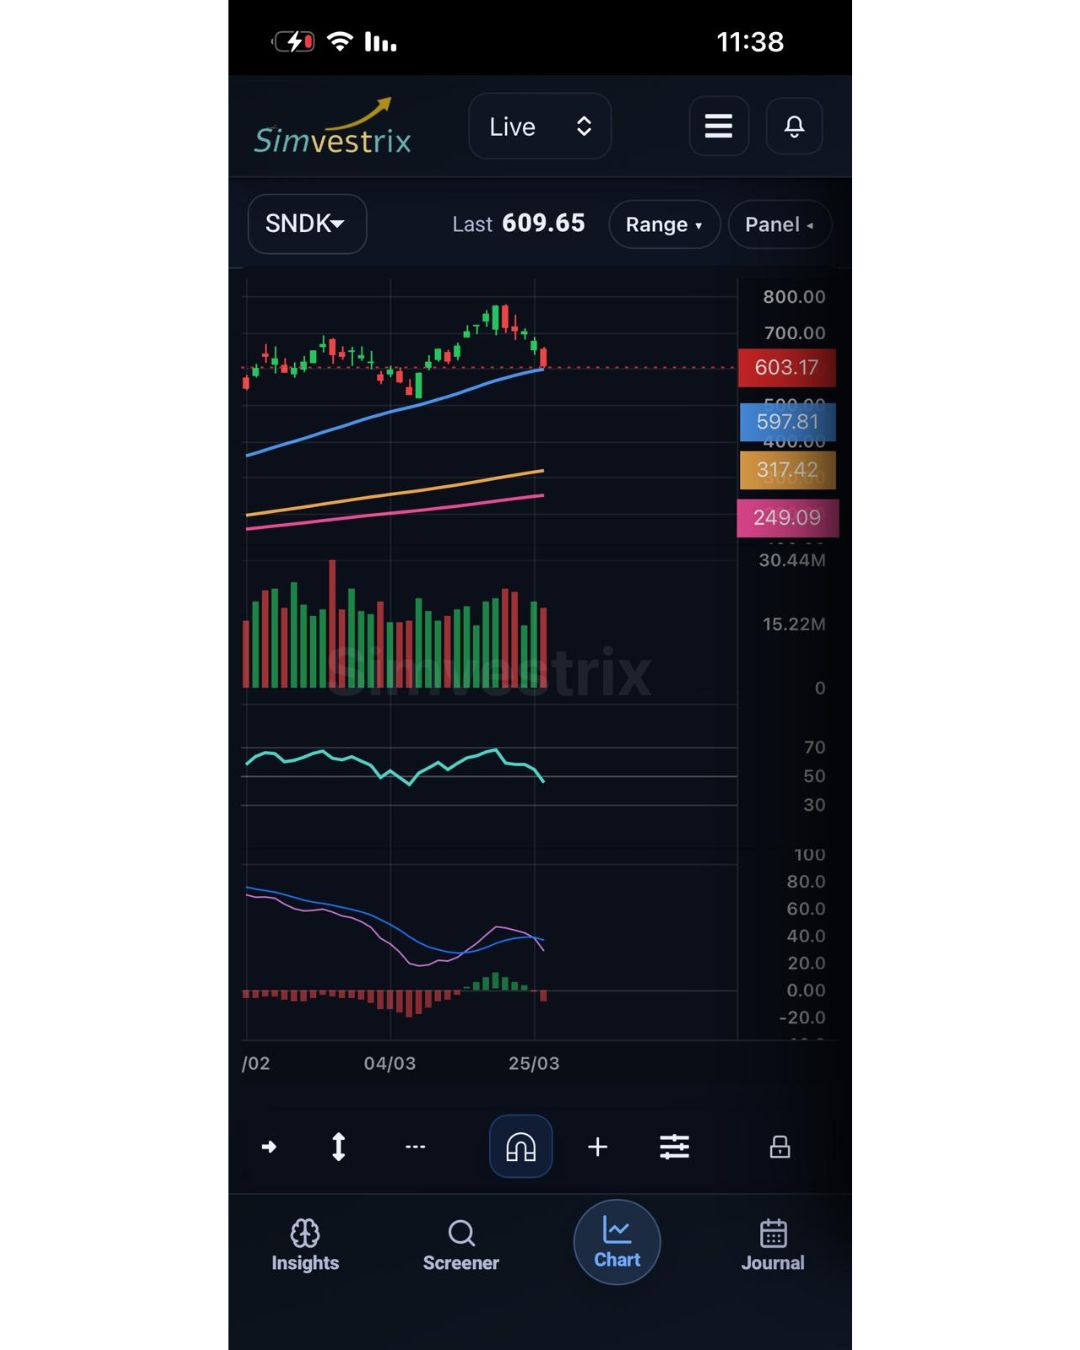
Step 4 — Chart page
Candlestick chart with built-in tools: MA20/50/150/200, Bollinger, MACD, RSI, Volume. Goal: understand trend, key levels, and volatility quickly.
- Enable MA200 and RSI for a baseline direction.
- Add MACD/Bollinger when you need more depth.
- Save interesting stocks to Watchlist with one click.
Step 5 — Trading account connection (optional)
If you want to execute actions from within Simvestrix, you can connect a trading account via a supported third-party brokerage provider. The connection is user-authorized (OAuth or a similar mechanism) and can be disconnected anytime. You can keep using the platform without connecting.
- Open the connect page and authorize securely (OAuth or a similar mechanism).
- After a successful connection, you can execute actions based on granted permissions.
- Disconnect anytime from Settings.
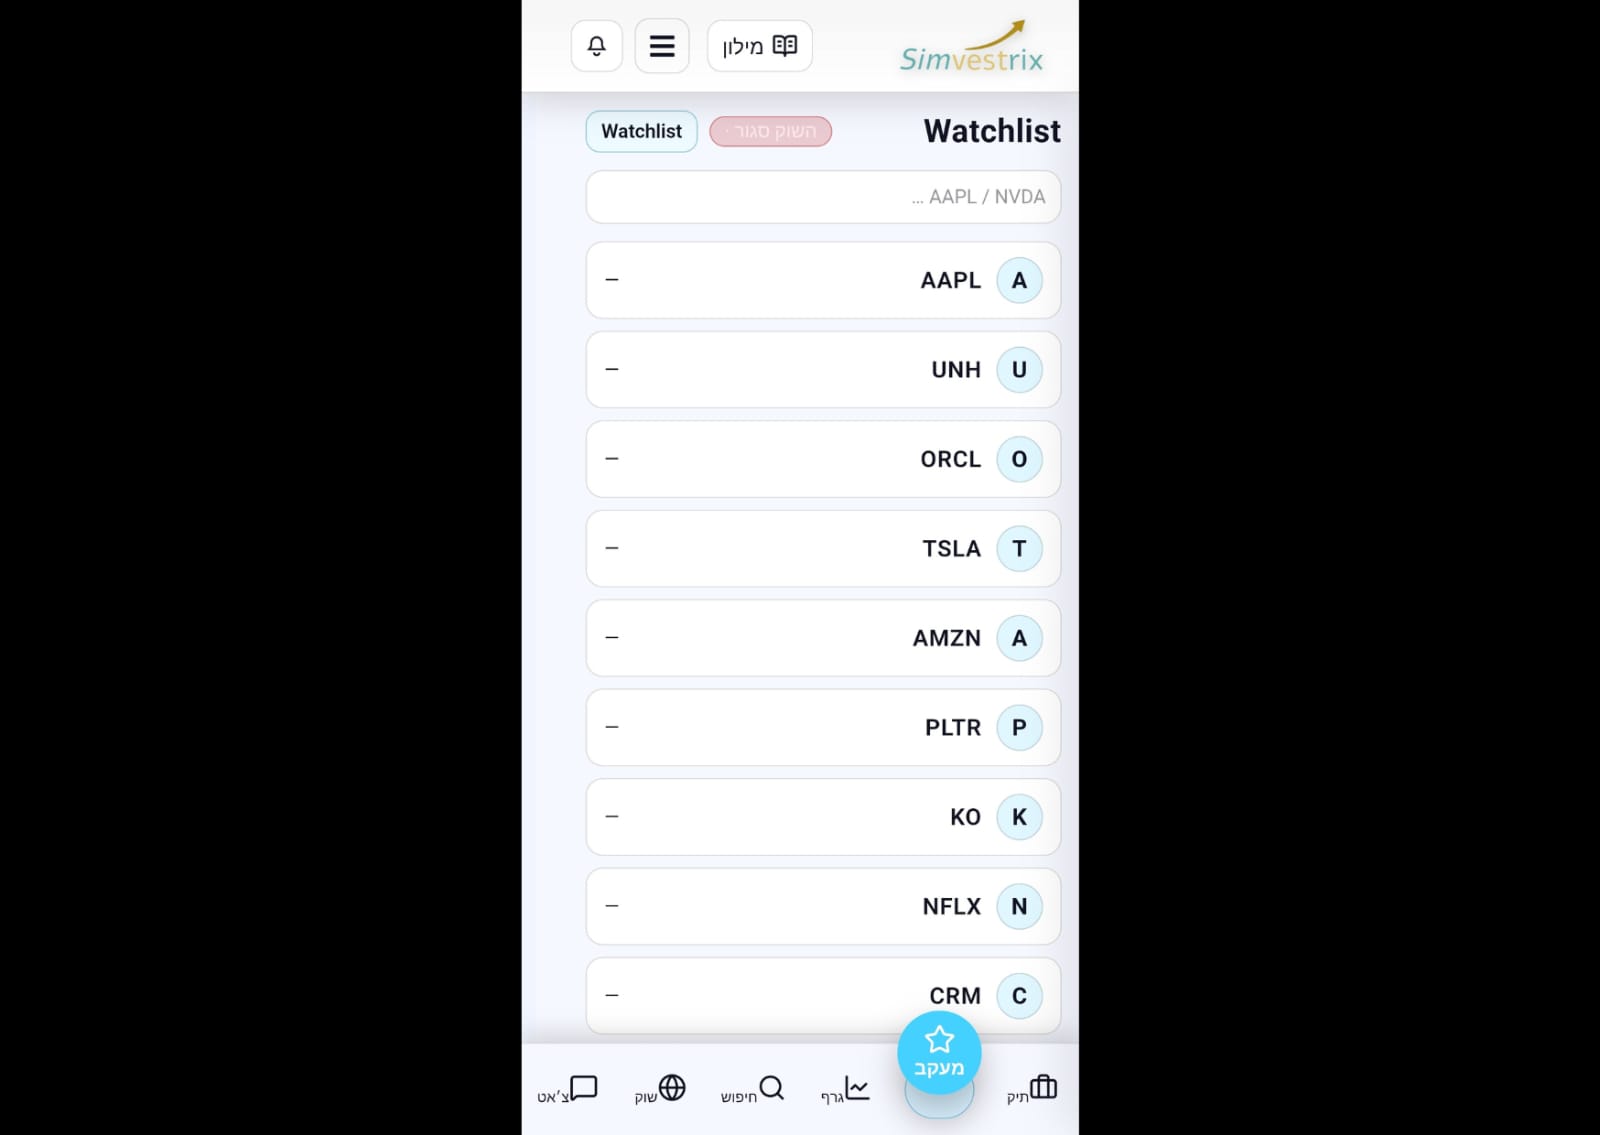
Step 6 — Watchlist
Collect stocks for quick review: add from Search, set price alerts, and jump to the chart.
- Add: type a symbol and press ➕ or Enter.
- Manage: 🗑️ delete • 🔔 alerts • open chart by clicking the symbol.
- Keep it focused (5–10 stocks) and review weekly.
FAQ
Disclaimer: Simvestrix is an information, analysis and learning platform. This content is not investment advice.